

Landlord & BTL Toolkit
Being a landlord is a numbers game, and the numbers have got harder — Section 24, tighter margins, and more to keep track of. This toolkit gives you a straight answer on what a rental actually returns, one place to see your whole portfolio at a glance, a clear read on how the mortgage-interest restriction hits your tax, and room-by-room control if you run an HMO. No jargon, just the figures that matter.
Tax rates sit in editable assumption cells, so when the rules change you update one cell rather than buying a new tool. Works in Excel and Google Sheets.
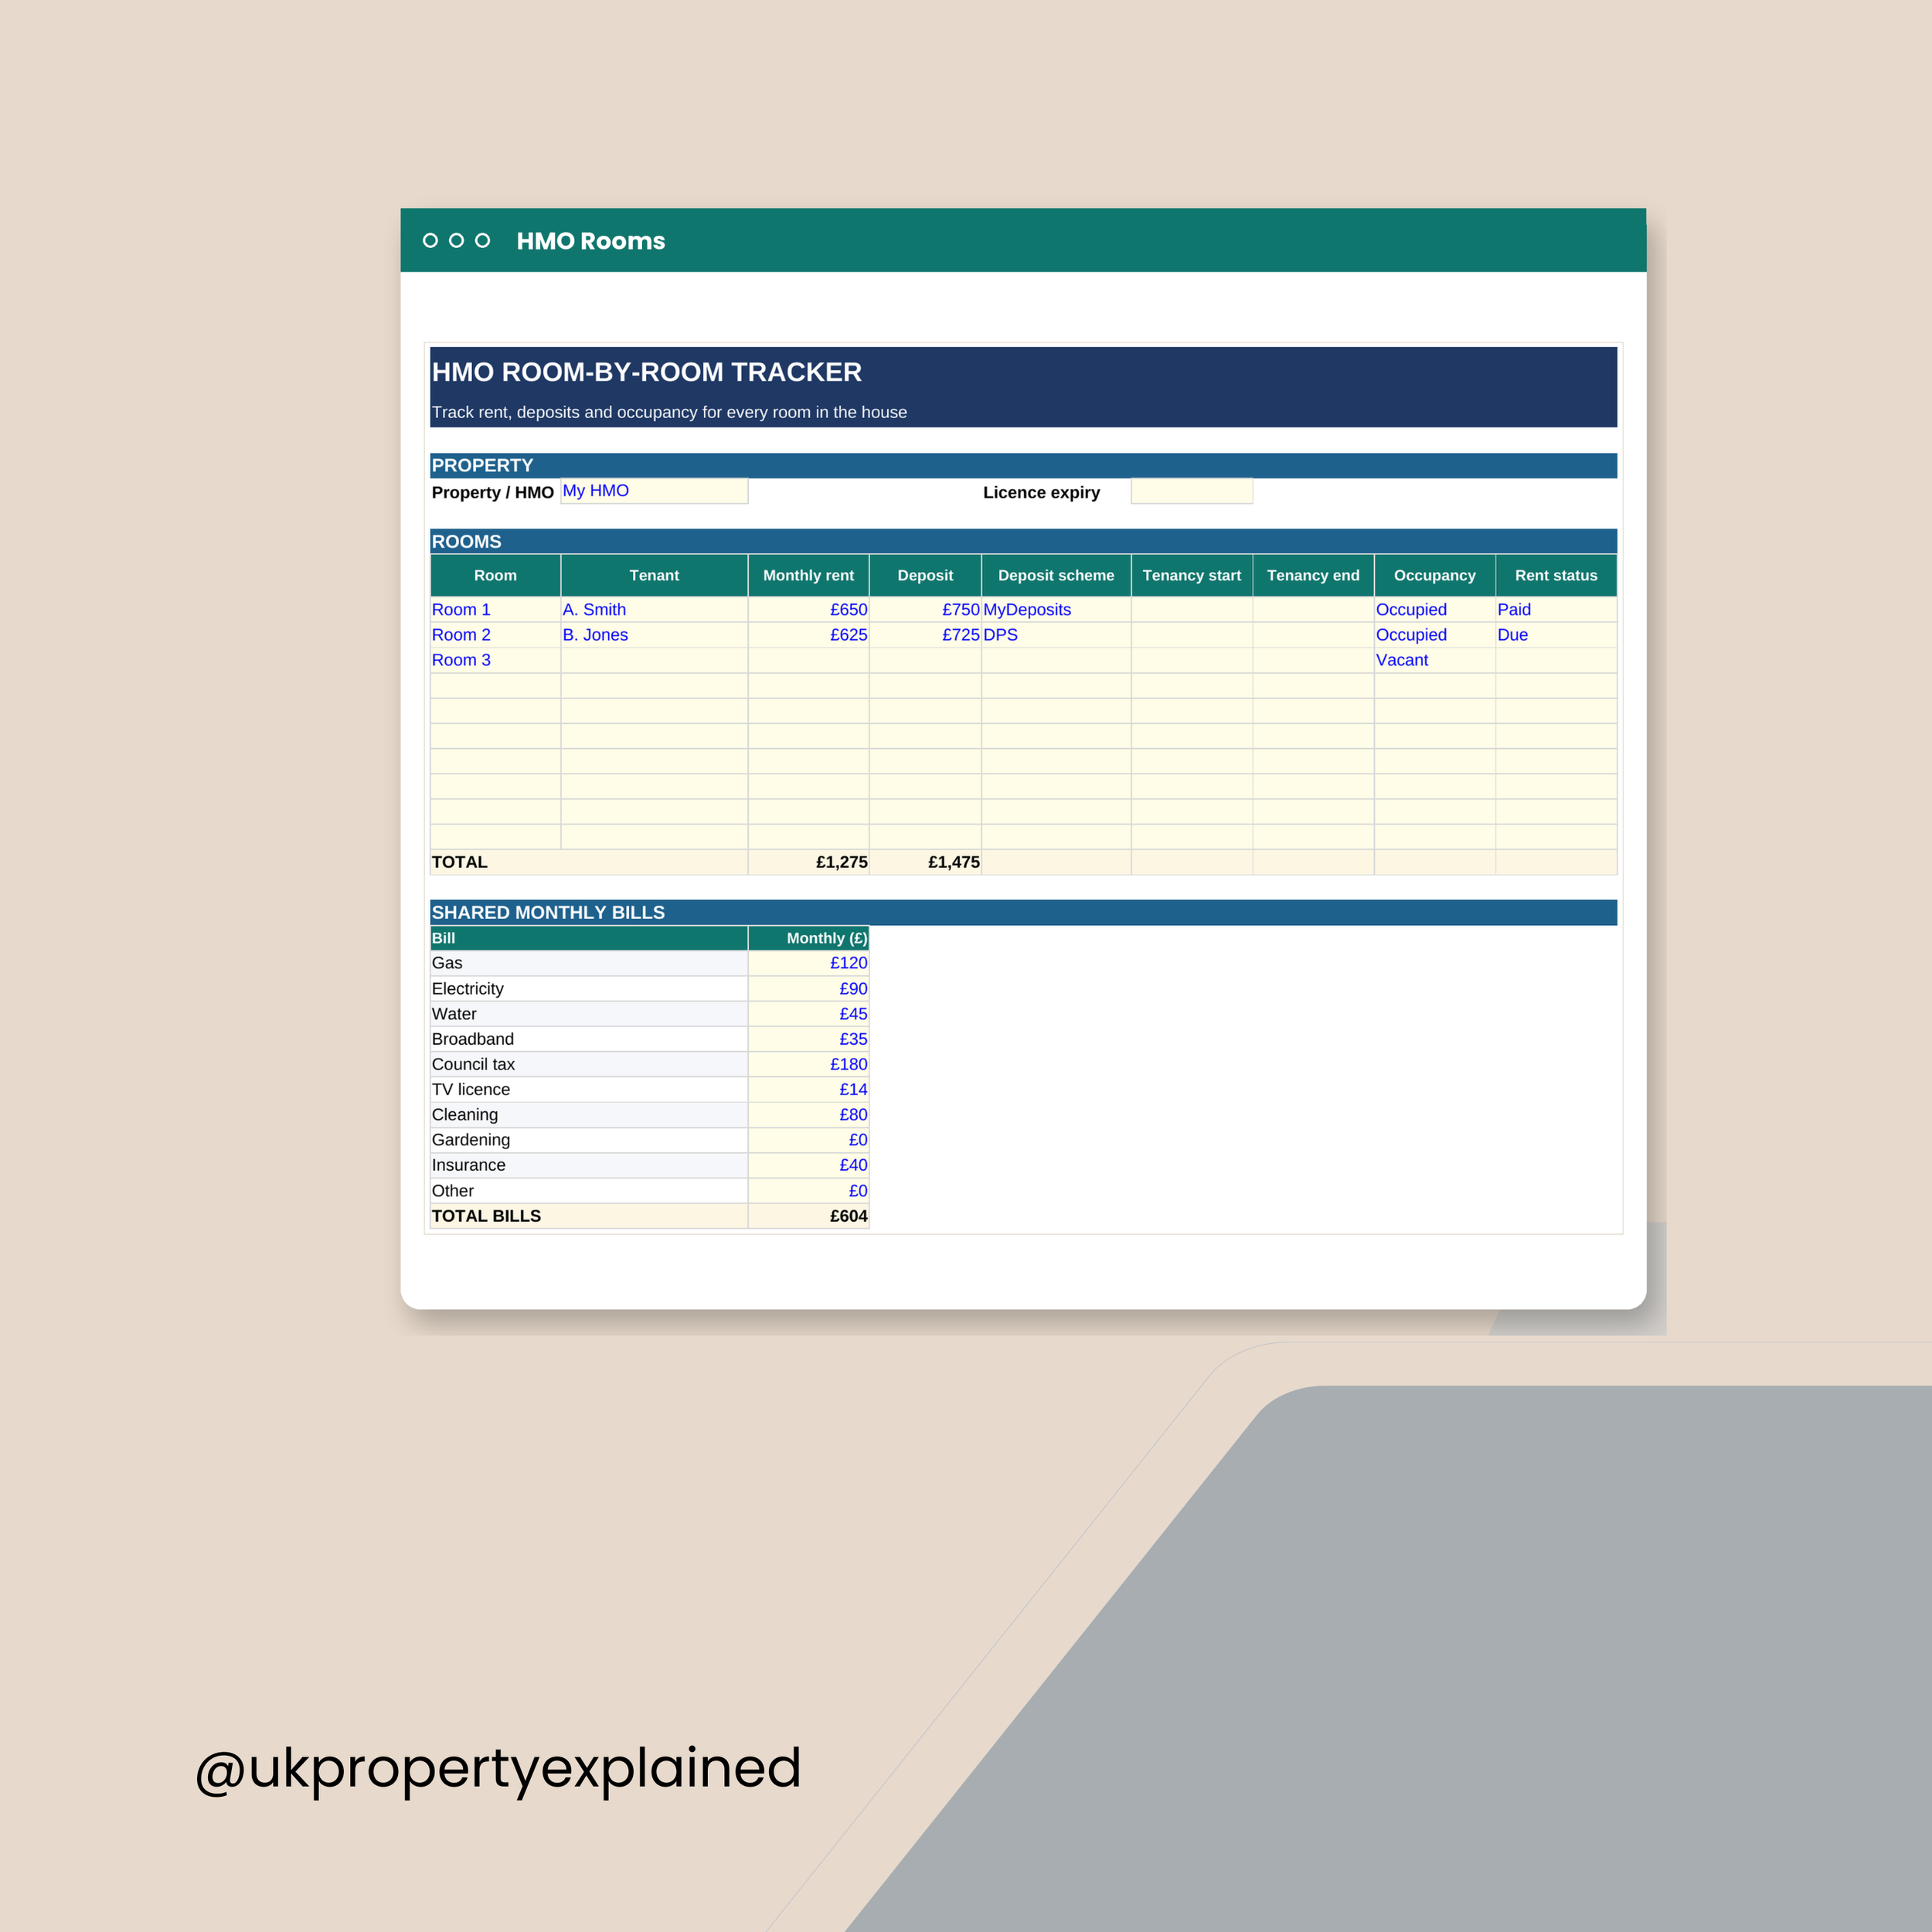
An HMO isn't one tenancy. It's five, with one boiler.
Track the house room by room.
FOR EACH ROOM (up to 10)
• Tenant, monthly rent, deposit and deposit scheme
• Tenancy start and end dates
• Occupancy — occupied or vacant
• Rent status — paid, due or arrears
PLUS THE SHARED BILLS
Gas, electricity, water, broadband, council tax, TV licence, cleaning,
gardening, insurance and anything else. The bills are yours in an HMO —
this is where they get counted.
THE DASHBOARD SHOWS
• Total rooms and rooms occupied
• Occupancy rate
• Rent from occupied rooms, versus full potential
• Rent you're losing to voids, every month
• Total monthly bills
• Net income — monthly and annual, after bills
• Deposits held, and rooms in arrears
There's a licence expiry field. Use it.
The gap between "full potential" and what you actually bank is the real
story of an HMO. Most people only see it at year end.
Excel (.xlsx). Works in Microsoft Excel and Google Sheets. Instant download.
Educational tool only. Not financial, tax or legal advice. Licensing rules
vary by council — check with yours. Correct as of July 2026.
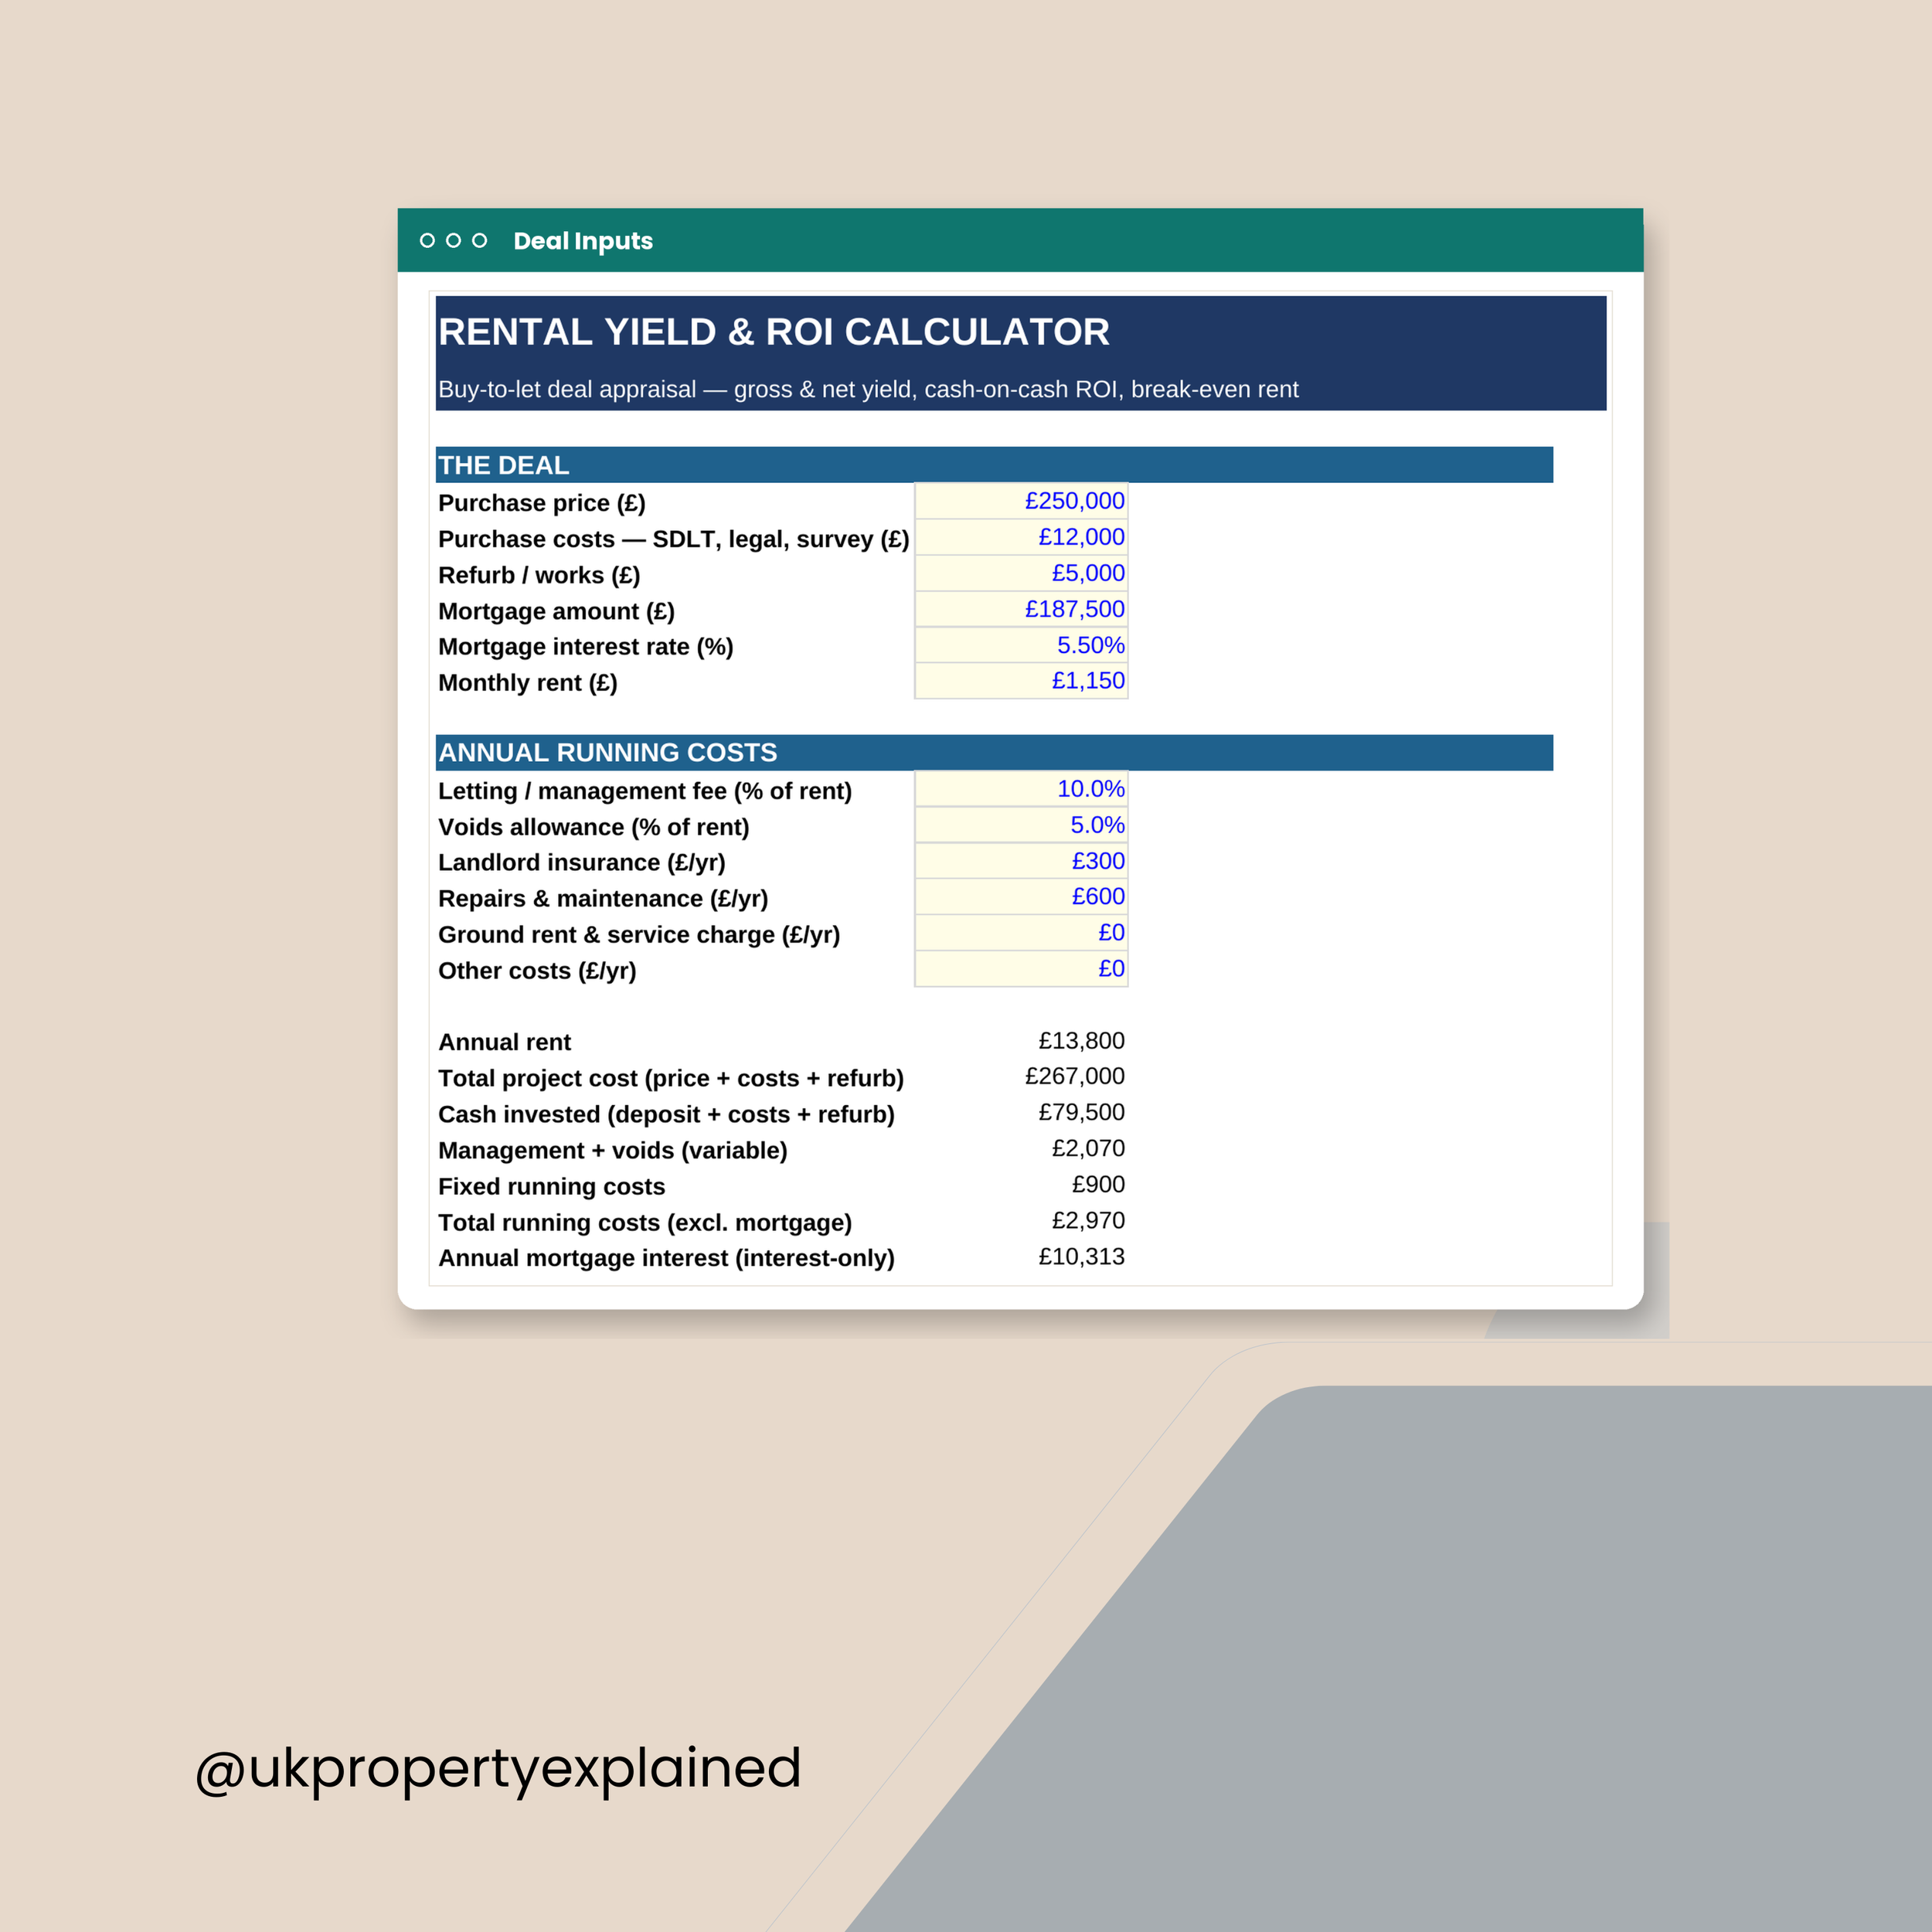
Most buy-to-let calculators tell you a deal is profitable. They don't tell you the lender is about to decline it.
This one does both.
Put in the price, the rent, the mortgage and your running costs. It gives you the honest numbers — and then it runs the deal through the same stress test your lender will.
WHAT IT WORKS OUT
Gross yield — on the purchase price, and on the total project cost
Net yield — after your running costs
Cash flow — monthly and annual, after costs and mortgage interest
Cash-on-cash ROI — the return on the money you actually put in
Break-even rent — the point at which cash flow hits zero
Sensitivity — what happens if rent drops 10%, or rates rise 2%
THE LENDER STRESS TEST
The stressed monthly payment, at a rate above the one you'll pay
The minimum rent the lender needs to see
Your headroom, in pounds
A straight PASS or FAIL
This is the part most people miss. Lenders don't lend on yield — they test the rent against an interest coverage ratio, usually 145% for a higher-rate taxpayer or 125% for a basic-rate taxpayer or limited company. A deal can look profitable and still be refused. Both cells are editable, so you can test the exact ratio your lender applies.
WHAT YOU GET
One Excel file (.xlsx), works in Microsoft Excel and Google Sheets
Yellow input cells — you only fill in what's yours
All rate cells editable, so it doesn't go out of date
Instant download
Built to show the downside as clearly as the upside. If a deal doesn't work, this will tell you.
Educational tool only. Not financial, mortgage, tax or legal advice. Figures and assumptions correct as of July 2026 — always confirm rents, costs and lending criteria before you commit to anything.
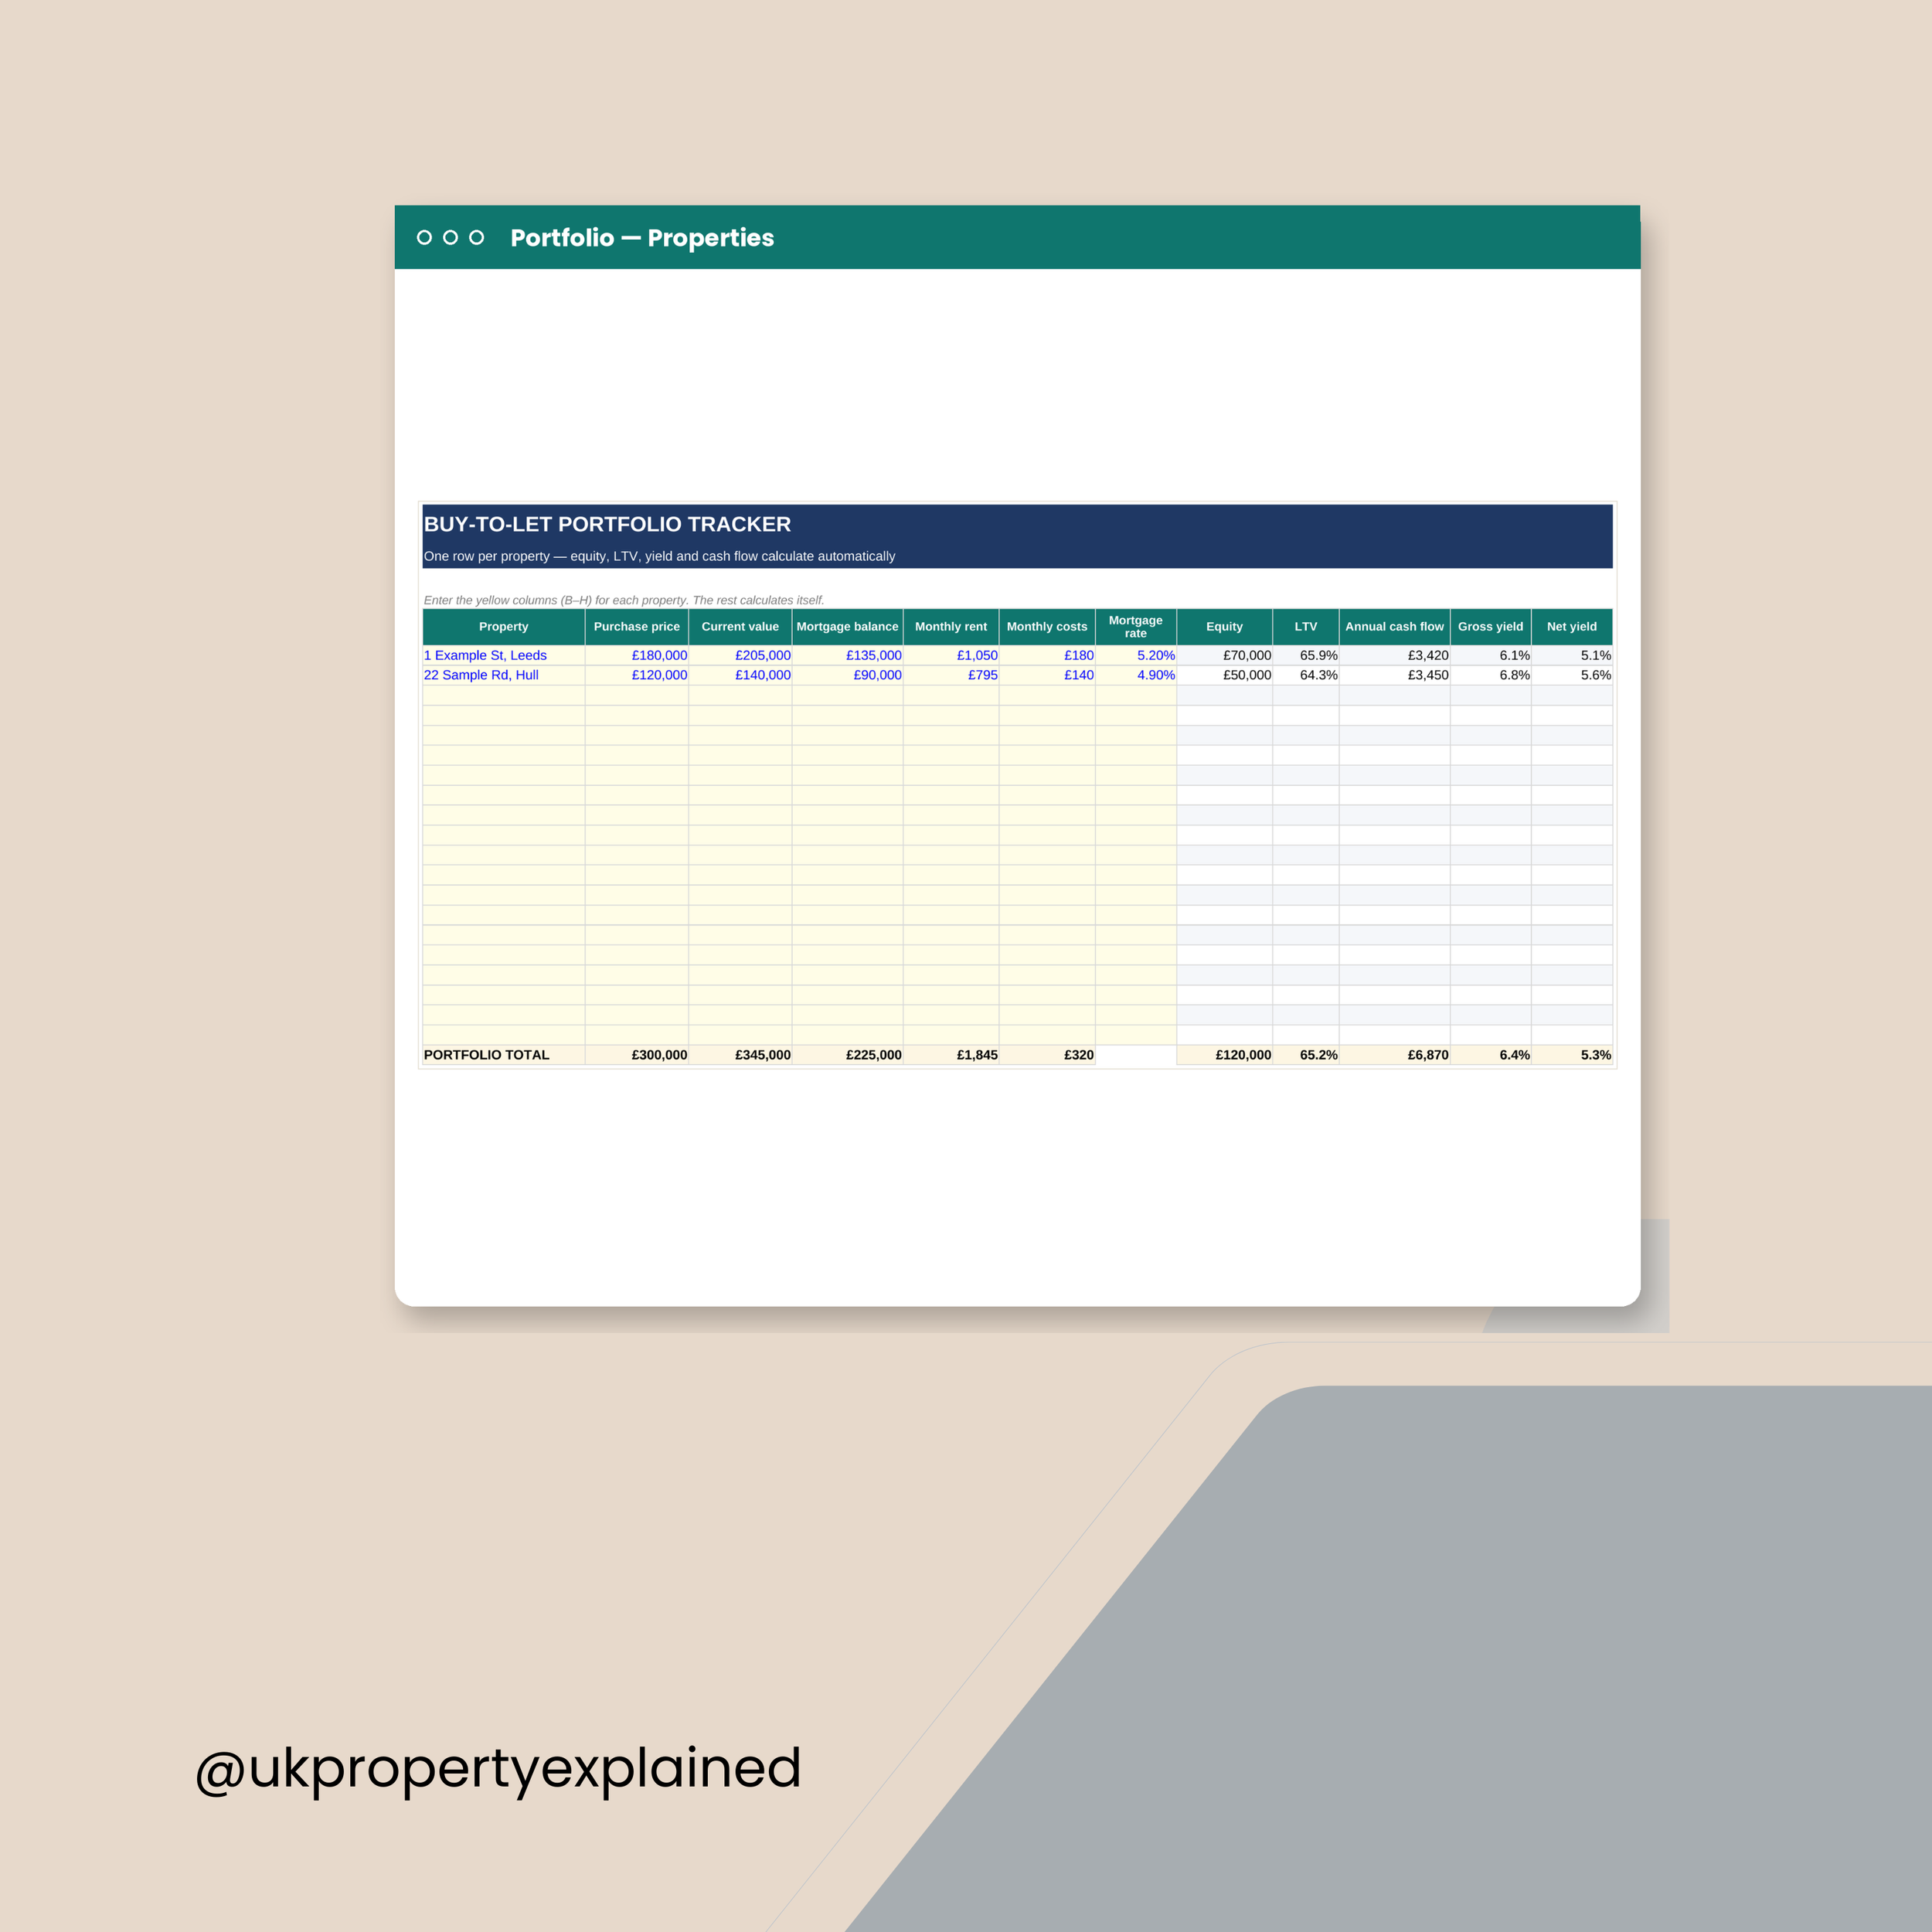
One row per property. One dashboard for the lot.
Once you're past two or three properties, the picture stops fitting in your
head. This is where it lives instead.
FOR EACH PROPERTY, YOU ENTER
• Purchase price and current value
• Mortgage balance and mortgage rate
• Monthly rent and monthly costs
IT WORKS OUT, PER PROPERTY
• Equity — what's actually yours
• Loan-to-value
• Annual cash flow
• Gross and net yield
AND ROLLS IT UP ON A DASHBOARD
• Number of properties, total portfolio value, total debt
• Total equity and your overall LTV
• Total monthly rent, and total cash flow — monthly and annual
• Average gross and net yield across everything you own
Room for up to 20 properties.
The number most landlords can't answer off the top of their head is their
overall LTV. It's the one lenders ask first.
Excel (.xlsx). Works in Microsoft Excel and Google Sheets. Instant download.
Educational tool only. Not financial, mortgage, tax or legal advice.
Correct as of July 2026.
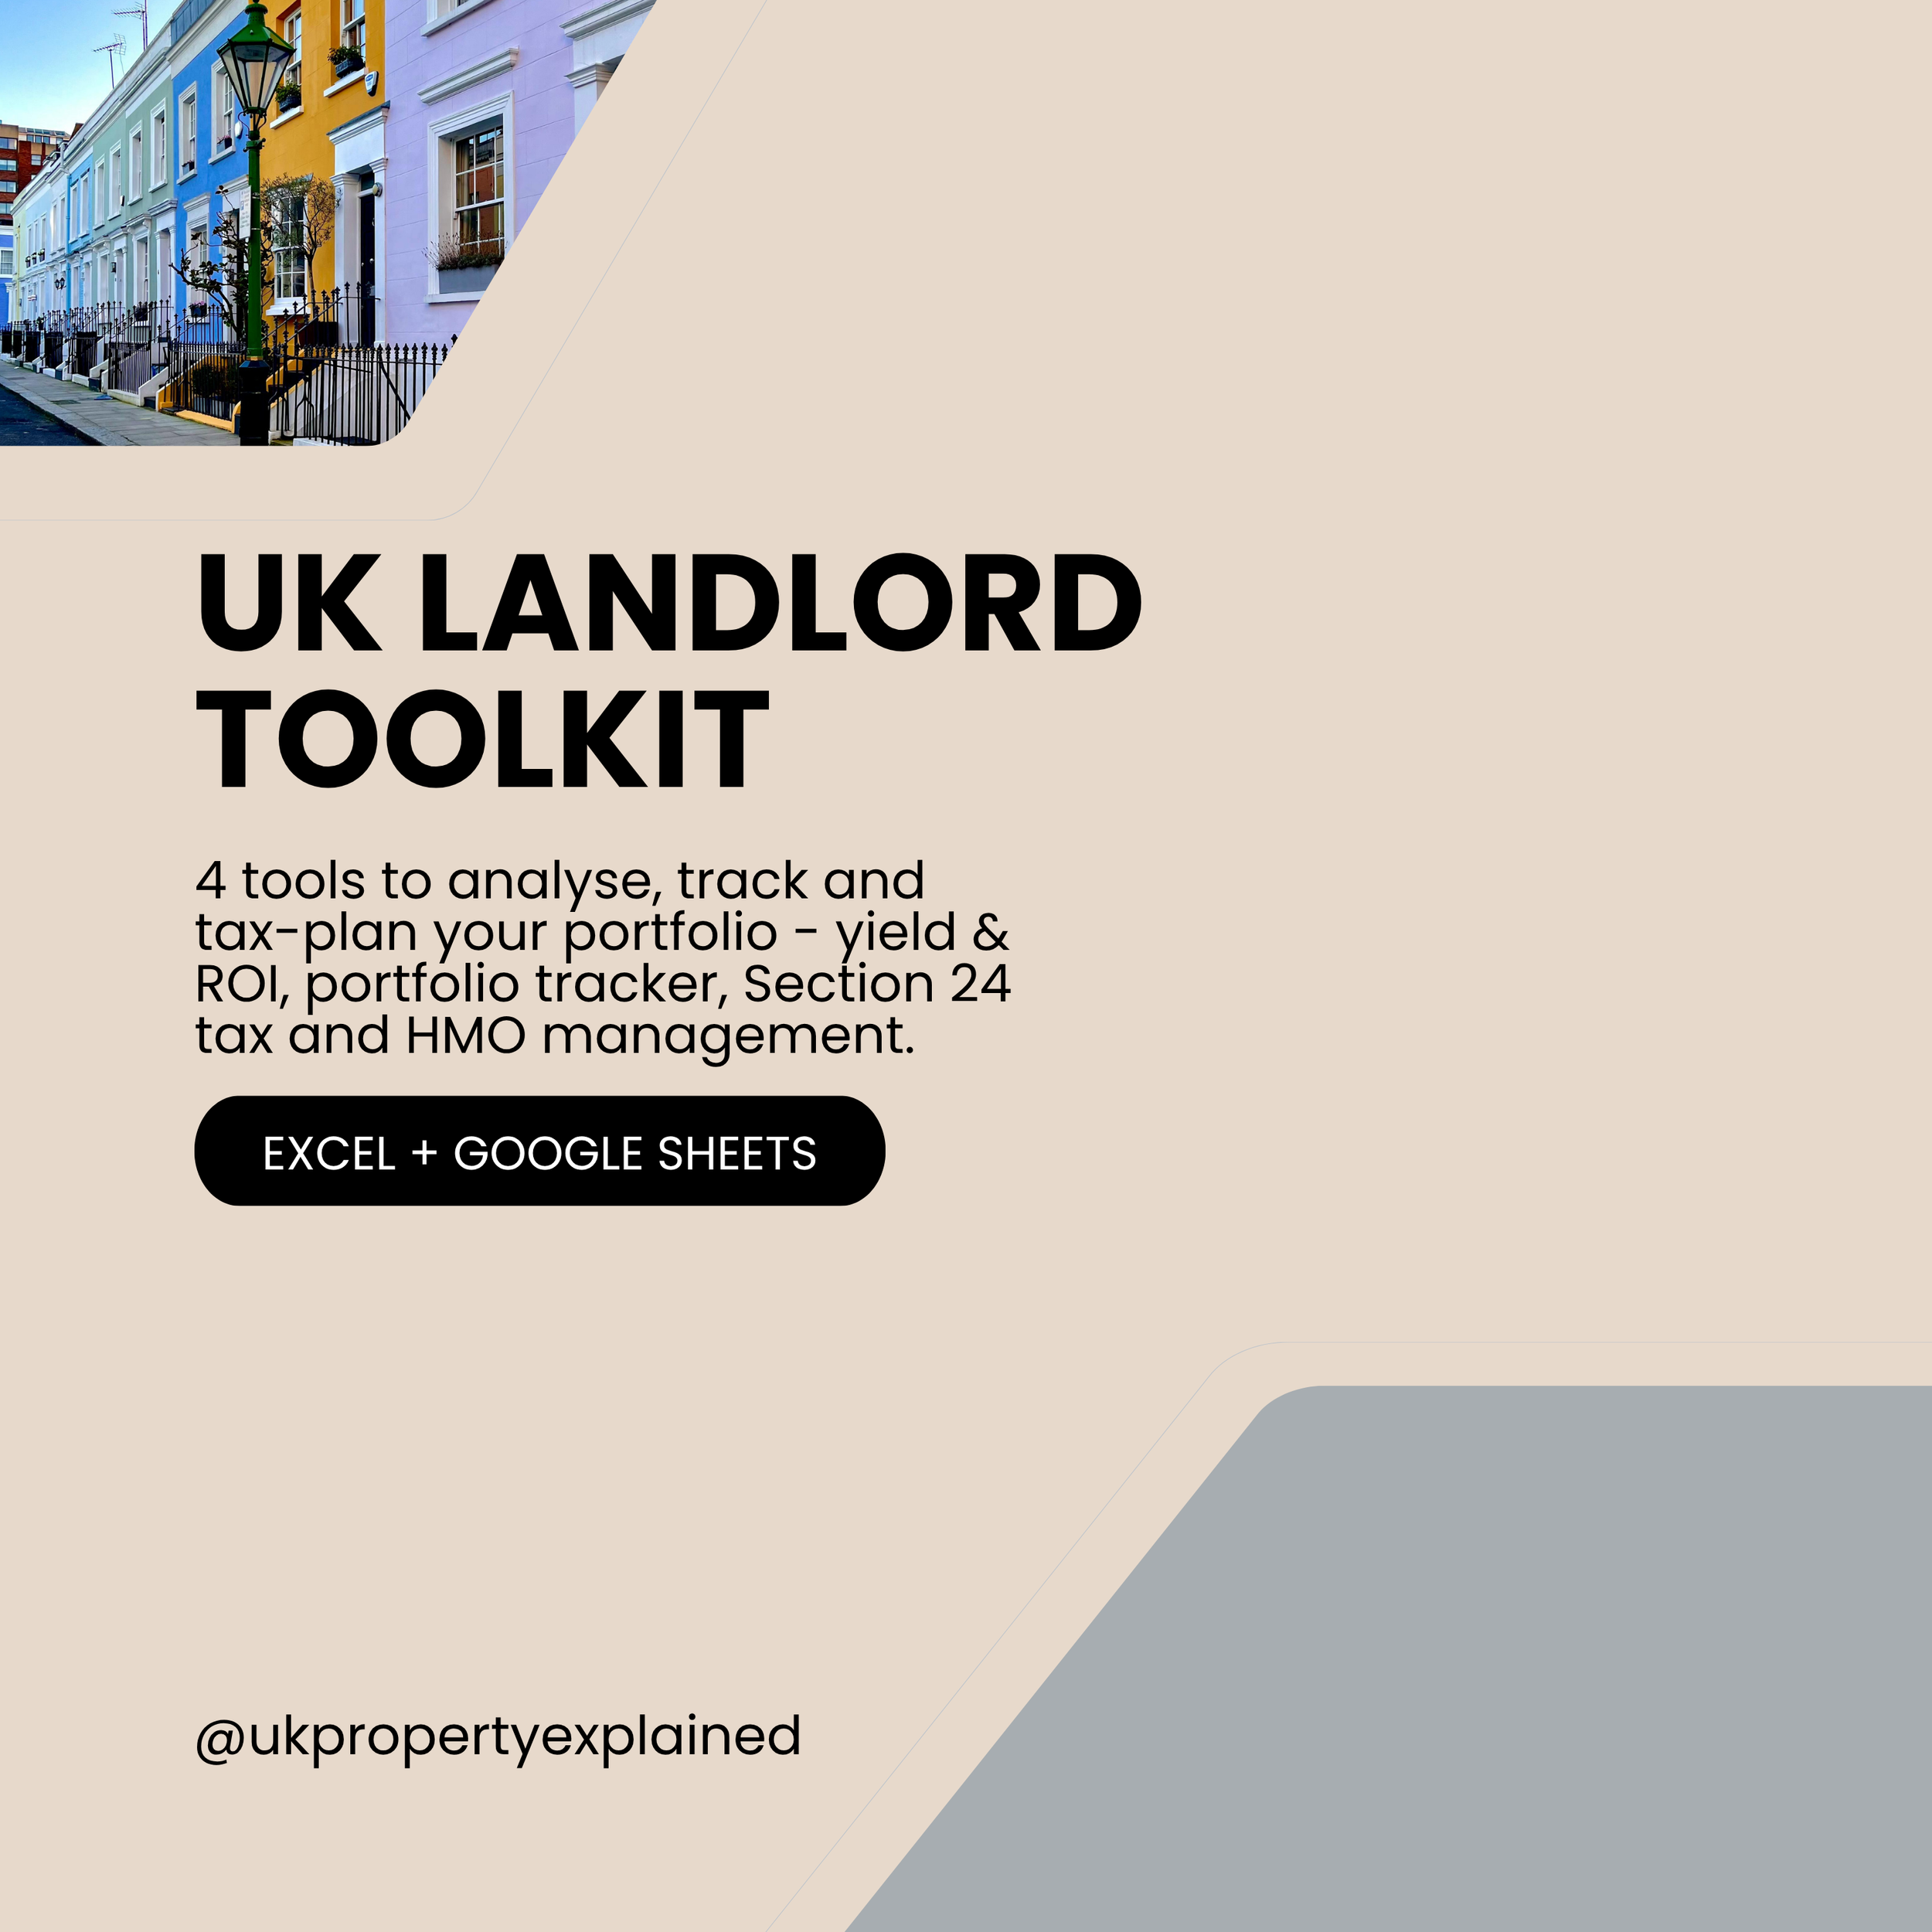
Everything you need to analyse, track and tax-plan a rental portfolio.
FOUR TOOLS
1. Rental Yield & ROI Calculator — appraise a deal before you buy. Gross and
net yield, cash flow, cash-on-cash ROI, break-even rent, and the lender's
stress test that decides whether you get the mortgage at all.
2. BTL Portfolio Tracker — one row per property, up to 20. Equity, LTV, cash
flow and yield each, rolled up on a live dashboard.
3. Section 24 Tax Calculator — what the mortgage-interest restriction actually
costs you, versus full deduction. Every rate editable.
4. HMO Room-by-Room Tracker — rent, deposits, occupancy and shared bills for
a shared house, with occupancy and net income on a dashboard.
PLUS the How-to-Use Guide (PDF) — a plain-English walkthrough of all four.
Buy a deal with the first. Track it with the second. Understand what the
taxman leaves you with the third.
4 x Excel files (.xlsx) + guide (PDF). Works in Microsoft Excel and Google
Sheets. Instant download.
Educational tools only. Not financial, mortgage, tax or legal advice.
Correct as of July 2026.
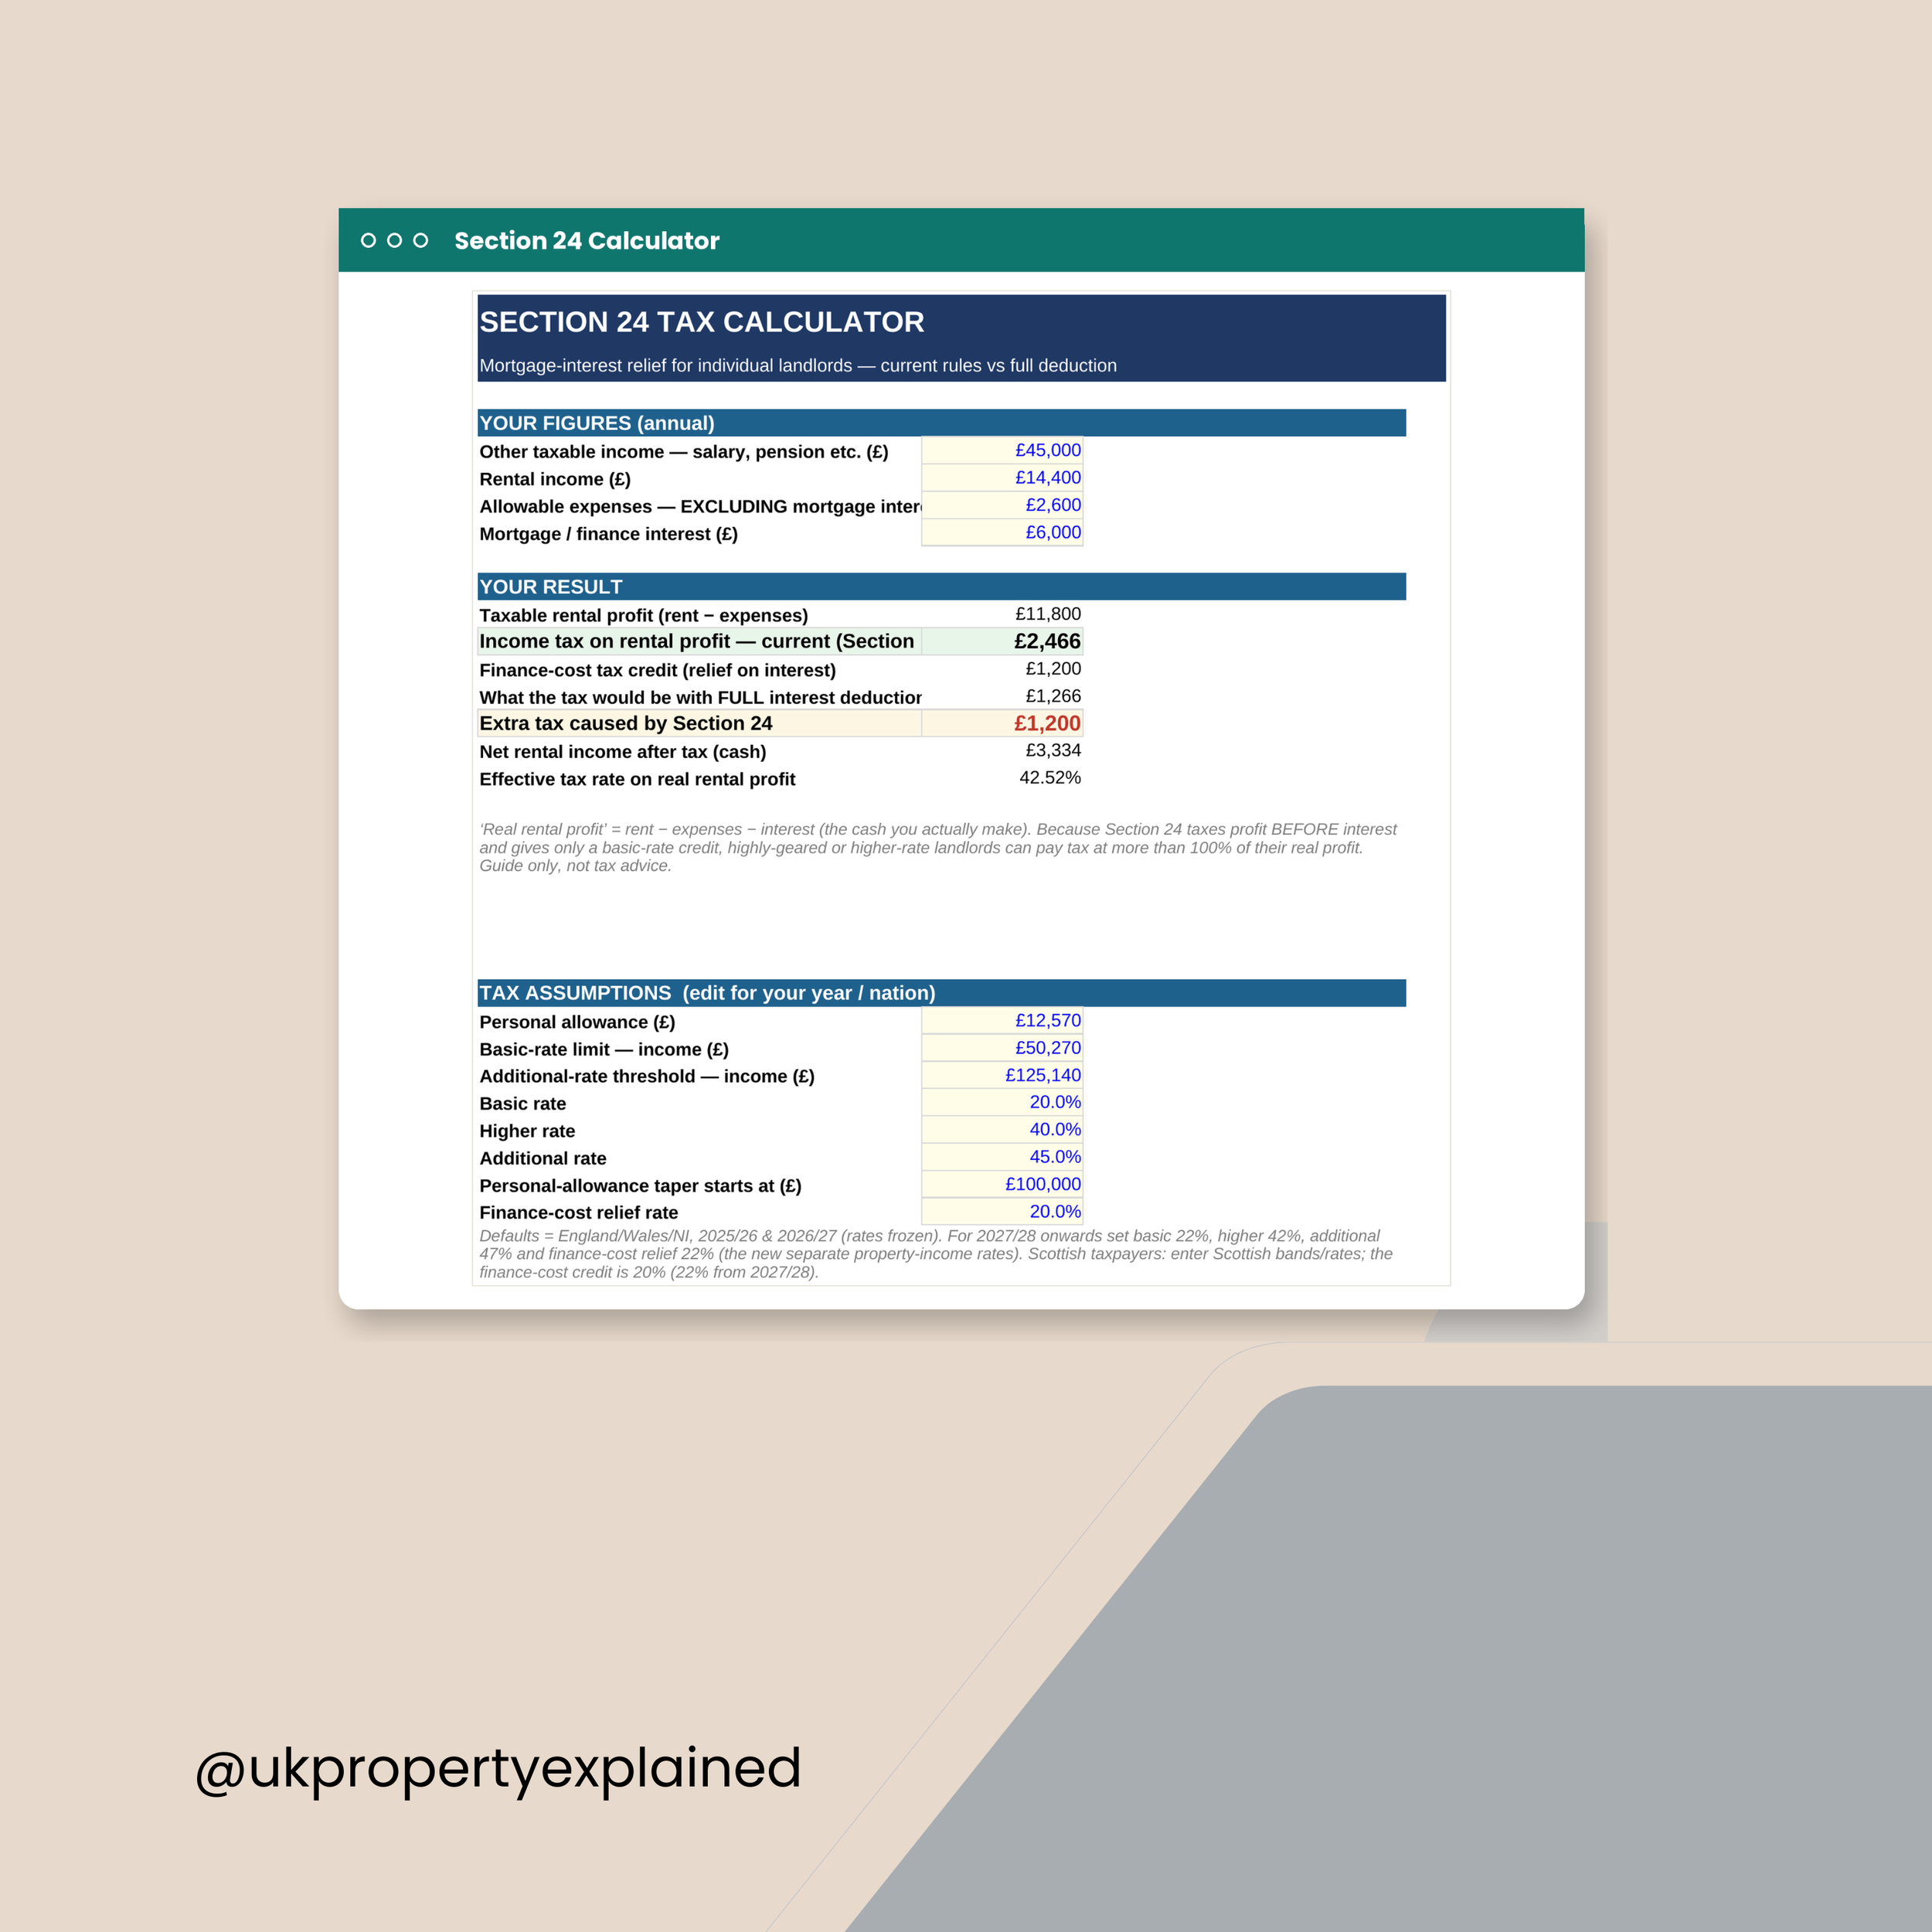
Section 24 is the rule that stopped landlords deducting mortgage interest.
It's why profitable properties still lose money.
This shows you exactly what it costs you.
YOU ENTER
• Your other income — salary, pension, anything else
• Rental income
• Allowable expenses, EXCLUDING mortgage interest
• Mortgage and finance interest
IT WORKS OUT
• Your taxable rental profit
• The income tax you actually pay under Section 24
• The finance-cost tax credit you get back
• What the tax WOULD have been with full interest deduction
• The extra tax Section 24 costs you — the number that matters
• Your net rental income after tax
• Your effective tax rate on real profit
Every tax assumption is editable: personal allowance, band thresholds, all
three rates, the allowance taper and the finance-cost relief rate. So when
the property income rates change in April 2027, you type in the new numbers
rather than buying a new spreadsheet.
Be warned: for a higher-rate taxpayer, this often shows a profitable
property producing a loss after tax. That's not a bug. That's Section 24.
Excel (.xlsx). Works in Microsoft Excel and Google Sheets. Instant download.
Educational tool only. Not tax advice — speak to an accountant before
restructuring anything. Correct as of July 2026.